The State of Student Journey Mapping in Higher Education

Student journey mapping can improve the student experience like few exercises can. Here are lessons from those in higher ed who have adopted the practice.

By: JP Rains
featured-image

Everyone in higher education wants to make decisions based on evidence and logic. We also have a desire to improve our student experience, from investing in food services to peer mentoring, most investments are student-centric. However, few tools give the appropriate first-party data to improve the student experience in a way that is customized for our campuses. Enter Student Journey Mapping. While the process of journey mapping is certainly not unique to higher education, we do have a unique lens, as our students (in my somewhat controversial opinion) are both our customer and our product. It is critical to understand their journey in order to improve the experiences they live. Having performed journey mapping exercises across a dozen campuses, I was very interested to explore how this process has evolved in other colleges and universities. To do so, I’ve canvassed the higher education community and interviewed leaders in this area who have implemented elements of journey mapping on their campuses. Article Contributors:

While working with these talented individuals, a few themes emerged as constants through each campus that are consistent with my experiences and thoughts on the future of Student Journey Mapping:

  1. It can be one of the best ways to shift internal process to become student-centric.
  2. It fosters the growth of experience-based research within institutional decision making
  3. It improves communication across campus through sharing the results
  4. It allows administrators to better understand student experiences in a quantitatively representative sample size while nuancing the results with qualitative data.

Journey Mapping for Process Improvement

In speaking with these leaders, it became clear that student journey mapping is a practice in which campus administrators and faculty members have extracted tremendous value. For most, this value has taken the shape of process improvement. One such example comes from Paul Redfern, now the Vice President for Communications at St. Lawrence University and formerly the Executive Director of Communications and Marketing at Gettysburg College. During Paul’s time at Gettysburg College, he was one of the leaders on campus implementing Student Journey Mapping to better understand a specific phase of the student experience. They sought out to learn more about this prospective undergraduate journey, and specifically discover the sections of that journey where Gettysburg incoming students were struggling.

“We brought together all of the administrators on campus that would have a touch point during this phase of journey and wrote them all out. Understanding where we had overlap and where we had gaps. The experience gave us a much better sense of everything that students would see and allowed us to change our process.”

This work not only improved the student journey, but has also been recognized more broadly at the CASE District II 2018 Accolades with a Gold Award in the Communications and Marketing category. While Paul has since joined St. Lawrence (and has begun a new student journey mapping exercise), he comments that there are many talented individuals who have continued to use this process to improve the student experience at Gettysburg.

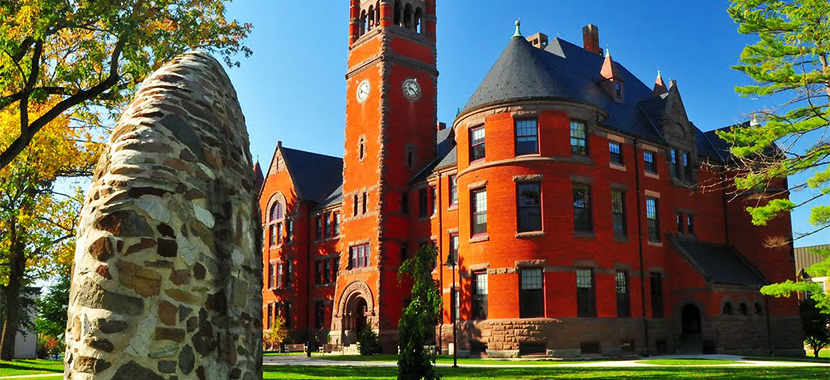
Gettysburg College

Growth of an “Experience Research” Culture

Another trend that came through was the idea that journey mapping (and related concepts) has fostered the growth of an experience-based research culture. At the University of Nevada, Las Vegas, Joe Winton, Director of Web & Digital Strategy, has seen a shift in their internal culture. His specific experience with elements of journey mapping take root in a website redesign which included thorough user research as a base for design changes.

“We really started to ask students what they thought and tried to learn how they were using the website. Understanding more of their tendencies allowed us to make changes based on research. We set up a display in a high traffic area of campus and learned directly from students. This type of research is growing as a culture around campus. We’re asking more questions, learning more about our students and creating better products because of it.”

While my conversation with Joe covered many areas of web and digital, we kept coming back to the first-party concept that this data-driven decision making was shaping operational activities on campus. Departments have increased their desire to collect first-party data and influence their decisions around those findings. They’ve gained a deeper understanding student challenges and have been able to address them where they start – with the student. Another part of my conversation with Joe, which was echoed by multiple leaders, was that communication across teams has improved. As one team discovers student tendencies and shares them with other teams, that becomes the expectation and propels a culture of data-driven decision making.

University of Nevada, Las Vegas

Improved Cross-Team Communication

This outcome of improved communication was also emphasized by Joseph Master, now at Drexel University as the Executive Director of Marketing & Digital Strategy (speaking primarily of his experiences as the former Assistant Dean, Marketing, Communications and Enrollment Strategy at Temple University’s College of Liberal Arts, a school with more than 400 faculty and 5,000 students. For Joseph, this communication was increased as the User Experience (UX) team at Temple (which is led by Meg Frisch) was able to dive into a very lengthy student journey mapping process and then communicate the results across their campus. This led to multiple discussions on campus which centred on improving the student experience and allowed senior leadership to have a further understanding of the prospective student thought process, especially from an emotional point of view.

“Journey mapping didn’t just help us understand the prospective student experience; it helped us to build administrative positions and messaging strategies to align with the experiences we mapped. And having deans in the room during the exercise was the best part. They saw all of the emotions – and all of the gaps – unfold in front of their eyes during our mapping exercise.”

More tangibly, the student journey mapping process was a significant factor in changes to his institution’s enrollment marketing infrastructure (specifically around the recruitment of transfer students). This enrollment process change, which led Joseph to push for the creation of a transfer advising role instead of a transfer enrollment position, led to what Joseph identified as “the largest enrollment increase for the College of Liberal Arts” in five years. More so, it helped build the kind of infrastructure necessary for sustained success.” “Rather than hire someone on my team, I was able to advocate for a very talented advisor to fill this gap on the advising team, bridging the gap between enrollment, marketing, and academic advising.” “Journey mapping isn’t just a user experience tool. It’s a communications tool. A PR tool. It is as much a tool for communicating as it is for charting those user journeys. Because once you do it, you realize that the journey cannot be separated from the advisors, the faculty and the marketers. The world gets smaller. And infrastructure begins to make sense. There is a reason journey mapping often leads to a tactical artifact…like a subway map. It is because the exercise can truly show you ‘the way.’“

Drexel University Main Building

Understanding Specific Challenges Faced by Students

As administrators, we are very well versed in the significant challenges faced by students. However, we have a filtered view of them – we only see the questions when they require intervention. We don’t see uncertainties, micro-questions and smaller the stressors students face. When evaluated in a cumulative sense, these uncertainties have a significant impact on the student experience. Stacey Funderburk, Director of Publications at Missouri State University, has used the journey mapping process to explore the experiences of local community college transfer students. Their work led to a deeper understanding of the uncertainties these students have about heading to campus. Their results found that their students were looking for more than checklists to support their transitions. Seems simple, but it’s perhaps not the first thing administrators would have thought of implementing. Stacey sees the journey mapping process evolving to respond to the needs of their institution over time. “It’s been a fantastic foundation for our teams to reaffirm what they are doing. There’s a need to revisit the student journey, as it changes over time. One of the things that gave us traction for this idea, is that we’ve had a wonderful history of enrolment growth. There are times where we think we will plateau, and we’re trying to implement as many plans as we can to continue to grow. We need to understand student needs to continue our sustained growth.”

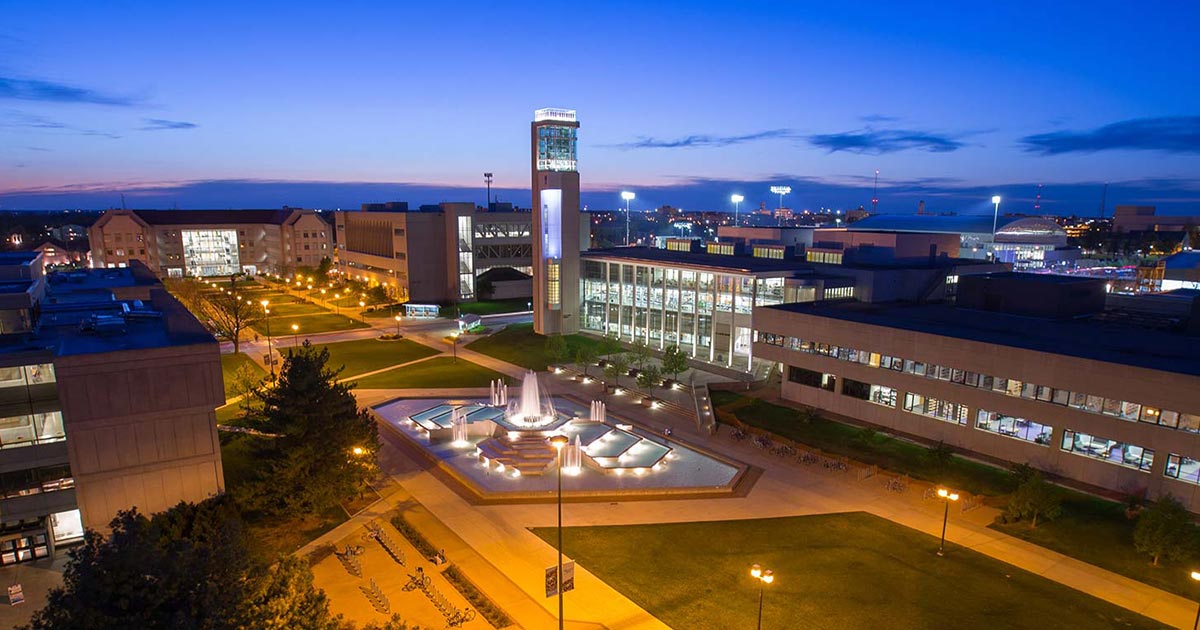
Missouri State University

Similarly, the journey-mapping pioneers at Temple University (as previously mentioned by Joseph Master) have found new insights by focusing their journey mapping efforts on specific audiences. One of these pioneers is Meg Frisch, Associate Director of Digital Strategy, Department of Strategic Marketing and Communications at Temple University. Due to their unique and diverse student population, there are specific audiences which they place a focus on. “Parents and family are very important to us because we have many first-generation students. Taking the customer experience mindset, putting our students and their families first is critical. We’ve done a tonne of usability testing and contextual inquiry while backing it up with behavioral metrics from Google Analytics. We have about two million pages and PDFs, we found that 70% of this is internal documents and wasn’t focused towards these audiences.”

“Our prospects were encountering too much information that didn’t relate to their student journey. We needed to focus on the content that relates to our audience and develop an internal content strategy. We’ve now been able to streamline our content and prioritize (from a project management standpoint) our actions based on the questions students are asking. For example, we know students are asking if we have their major, we need to start there.”

Frisch also commented that they have also been able to help people shift their organizational labels from a scenario where they had mirrored the institution’s hierarchy to a more articulate presentation that allows students to better identify with an activity’s label. Students don’t know what a Registrar does, but they know how to appeal a mark in a course. This focus on students has allowed their team to transfer the academic program content from individual schools/colleges microsites to the central temple.edu site. Through this, they’ve seen a dramatic visibility in organic search and user engagement (pages per session, time on page). It has also allowed them to update the content in a central database, increasing accuracy and reducing duplication.

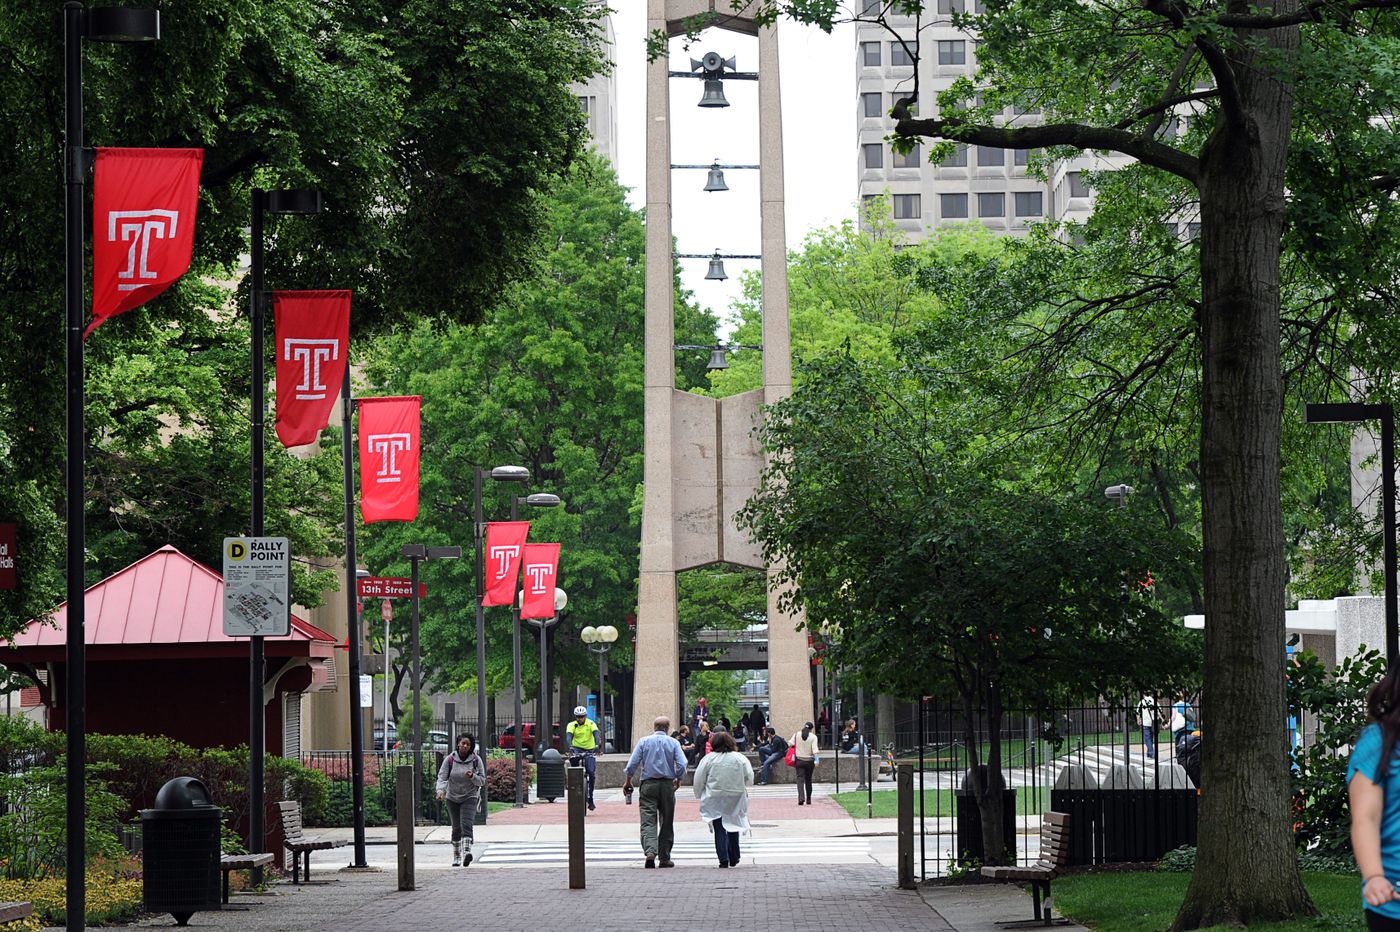
Temple University Bell Tower

The Future of Journey Mapping

This brings me to conclude that throughout these conversations, many commonalities point to similar conclusions. As a sector, we need to hear more from our students and improve our process. Many times, this will be motivated by an end result to positively impact student enrolment, however, the process can be used to achieve any number of positive outcomes for our students. These positive results canfirst-party and should be, reached through the mix of both qualitative and quantitative research that journey mapping can deliver. Furthermore, sharing these results (which are quite specific to our individual campuses) across institutions can increase the digital IQ of our industry. As Frisch put it “we could do very well for ourselves if we were more open with each other about our findings.” In conversations with each leader, I’ve heard that they are all pursuing additional journey mapping activities to further understand sections of the student journey. Whether that is how they engage as a prospective graduate student with our institutions, how international students complete their processes around obtaining study permits, or even about how a specific academic program achieves exceptional degree completion rates. In all of these cases, we have much to learn. The ways in which journey mapping is being used is also expanding, with origins in changing the tone and voice of communications for students, this process is also influencing the navigation of a website, the internal admissions process and even the signage on campuses. In summary, we need to use student journey mapping as a way to listen to our students, change our administrative practices, and deliver a student experience that exceeds expectations. The moment we stop learning from students is the moment we stray from a foundational tenet. This piece was originally published at Rains Media

JP Rains

JP Rains

Director, Digital Strategy

JP Rains is the director of digital strategy at Laurentian University. He is also the president of of Rains Media, where he works with clients in education, sport, politics, and industry on web strategy, social media, and advertising. He is a board member with the Laurentian University Alumni Association, president of the SPAD Alumni Chapter, co-chair of the Golf Marathon For Hope, and a winner of Sudbury’s Top 40 under 40.


Newsletter Sign up!

Stay current in digital strategy, brand amplification, design thinking and more.

This field is for validation purposes and should be left unchanged.
Goodbye, US News? Alternative college rankings are reshaping higher education article image. A collage of four images representing different aspects of higher education: A historic, red-brick college building with tall, ornate towers and large windows under a clear blue sky. Students sitting in a lecture hall, working on laptops and taking notes. Close-up of hands writing on papers with a laptop and stationery nearby, symbolizing studying and problem-solving. A student sitting outdoors on a green lawn, using a laptop with books and a bag beside them, highlighting flexibility and independent learning.

Goodbye, US News? Alternative rankings are reshaping higher ed.

Alternatives like Colleges That Change Lives and FindaBetterU are shifting the focus from prestige to student satisfaction, campus culture and affordability.

Student Experience /
By: Aila Boyd
"The NIL Top 10: Who are the highest-paid college athletes?" article image displaying a collage of six college athletes across different sports, each wearing their team uniforms and caught in action. The top row includes a basketball player from North Carolina dribbling the ball, a gymnast on the floor mid-performance, and a football player from Colorado gesturing with his hands after a game. The bottom row shows a Duke basketball player preparing to take a shot, another football player from Colorado looking focused, and an Alabama basketball player pointing confidently.

The NIL Top 10: Who are the highest-paid college athletes?

Growing collective contracts and sponsorship deals have university athletes — both men and women — raking in record paydays.

Marketing & Branding /
By: Chris Kudialis
Is AI-driven search a game-changer for universities? article image, close-up portrait of a female wearing round glasses with a gold-tinted reflection, looking at a digital screen, golden bokeh background.

How AI Can Optimize Academic Programming and Student Support

Academics and advocacy leaders say the next couple of years could offer exponential developments, but departmental application is key.

Student Experience /
By: Chris Kudialis
Goodbye, US News? Alternative college rankings are reshaping higher education article image. A collage of four images representing different aspects of higher education: A historic, red-brick college building with tall, ornate towers and large windows under a clear blue sky. Students sitting in a lecture hall, working on laptops and taking notes. Close-up of hands writing on papers with a laptop and stationery nearby, symbolizing studying and problem-solving. A student sitting outdoors on a green lawn, using a laptop with books and a bag beside them, highlighting flexibility and independent learning.

Goodbye, US News? Alternative rankings are reshaping higher ed.

Alternatives like Colleges That Change Lives and FindaBetterU are shifting the focus from prestige to student satisfaction, campus culture and affordability.

Student Experience /
By: Aila Boyd
"The NIL Top 10: Who are the highest-paid college athletes?" article image displaying a collage of six college athletes across different sports, each wearing their team uniforms and caught in action. The top row includes a basketball player from North Carolina dribbling the ball, a gymnast on the floor mid-performance, and a football player from Colorado gesturing with his hands after a game. The bottom row shows a Duke basketball player preparing to take a shot, another football player from Colorado looking focused, and an Alabama basketball player pointing confidently.

The NIL Top 10: Who are the highest-paid college athletes?

Growing collective contracts and sponsorship deals have university athletes — both men and women — raking in record paydays.

Marketing & Branding /
By: Chris Kudialis
A picture taken from behind a man in a commencement cap and gown with tassel

How Are Commencement Speakers, Honorary Degrees Selected?

Amid the 2024 spring semester division, higher education institutions cite unifying selection criteria for honorary degrees and commencement speakers.

Donor & Alumni Relations /
By: J. Aelick