The Prospect Pool
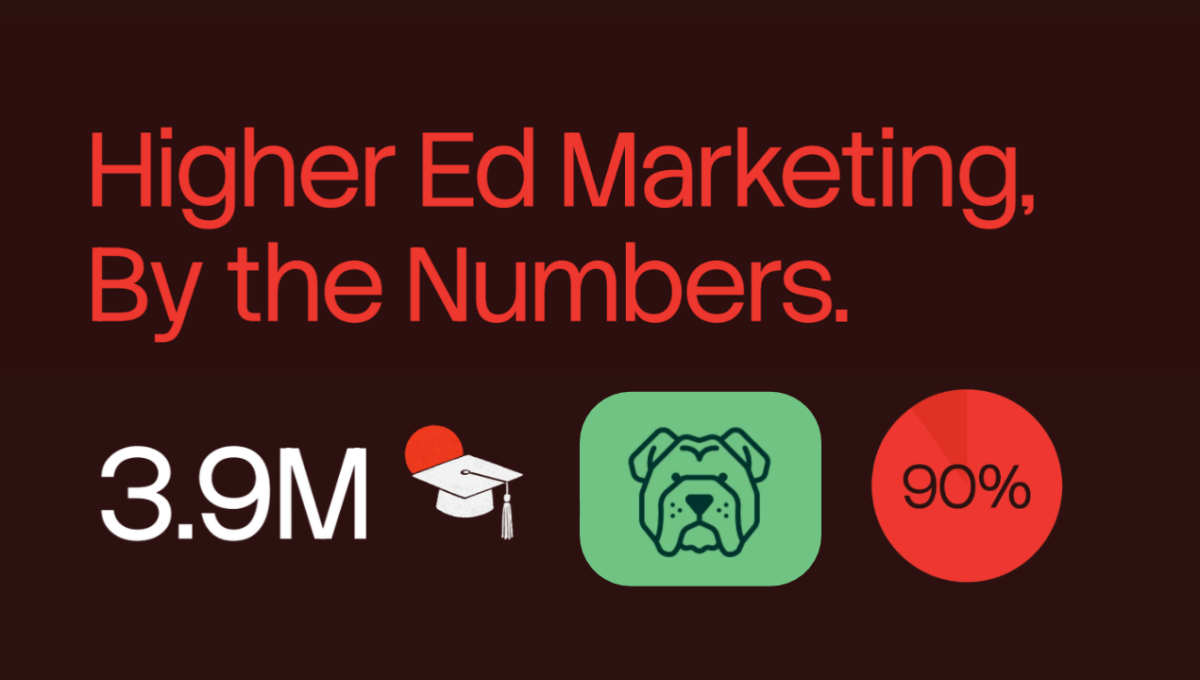
3.9 million — That’s the record number of U.S. high school graduates projected for 2025, the peak before a slow, steady decline through 2041. WICHE, “Knocking at the College Door,” 2024
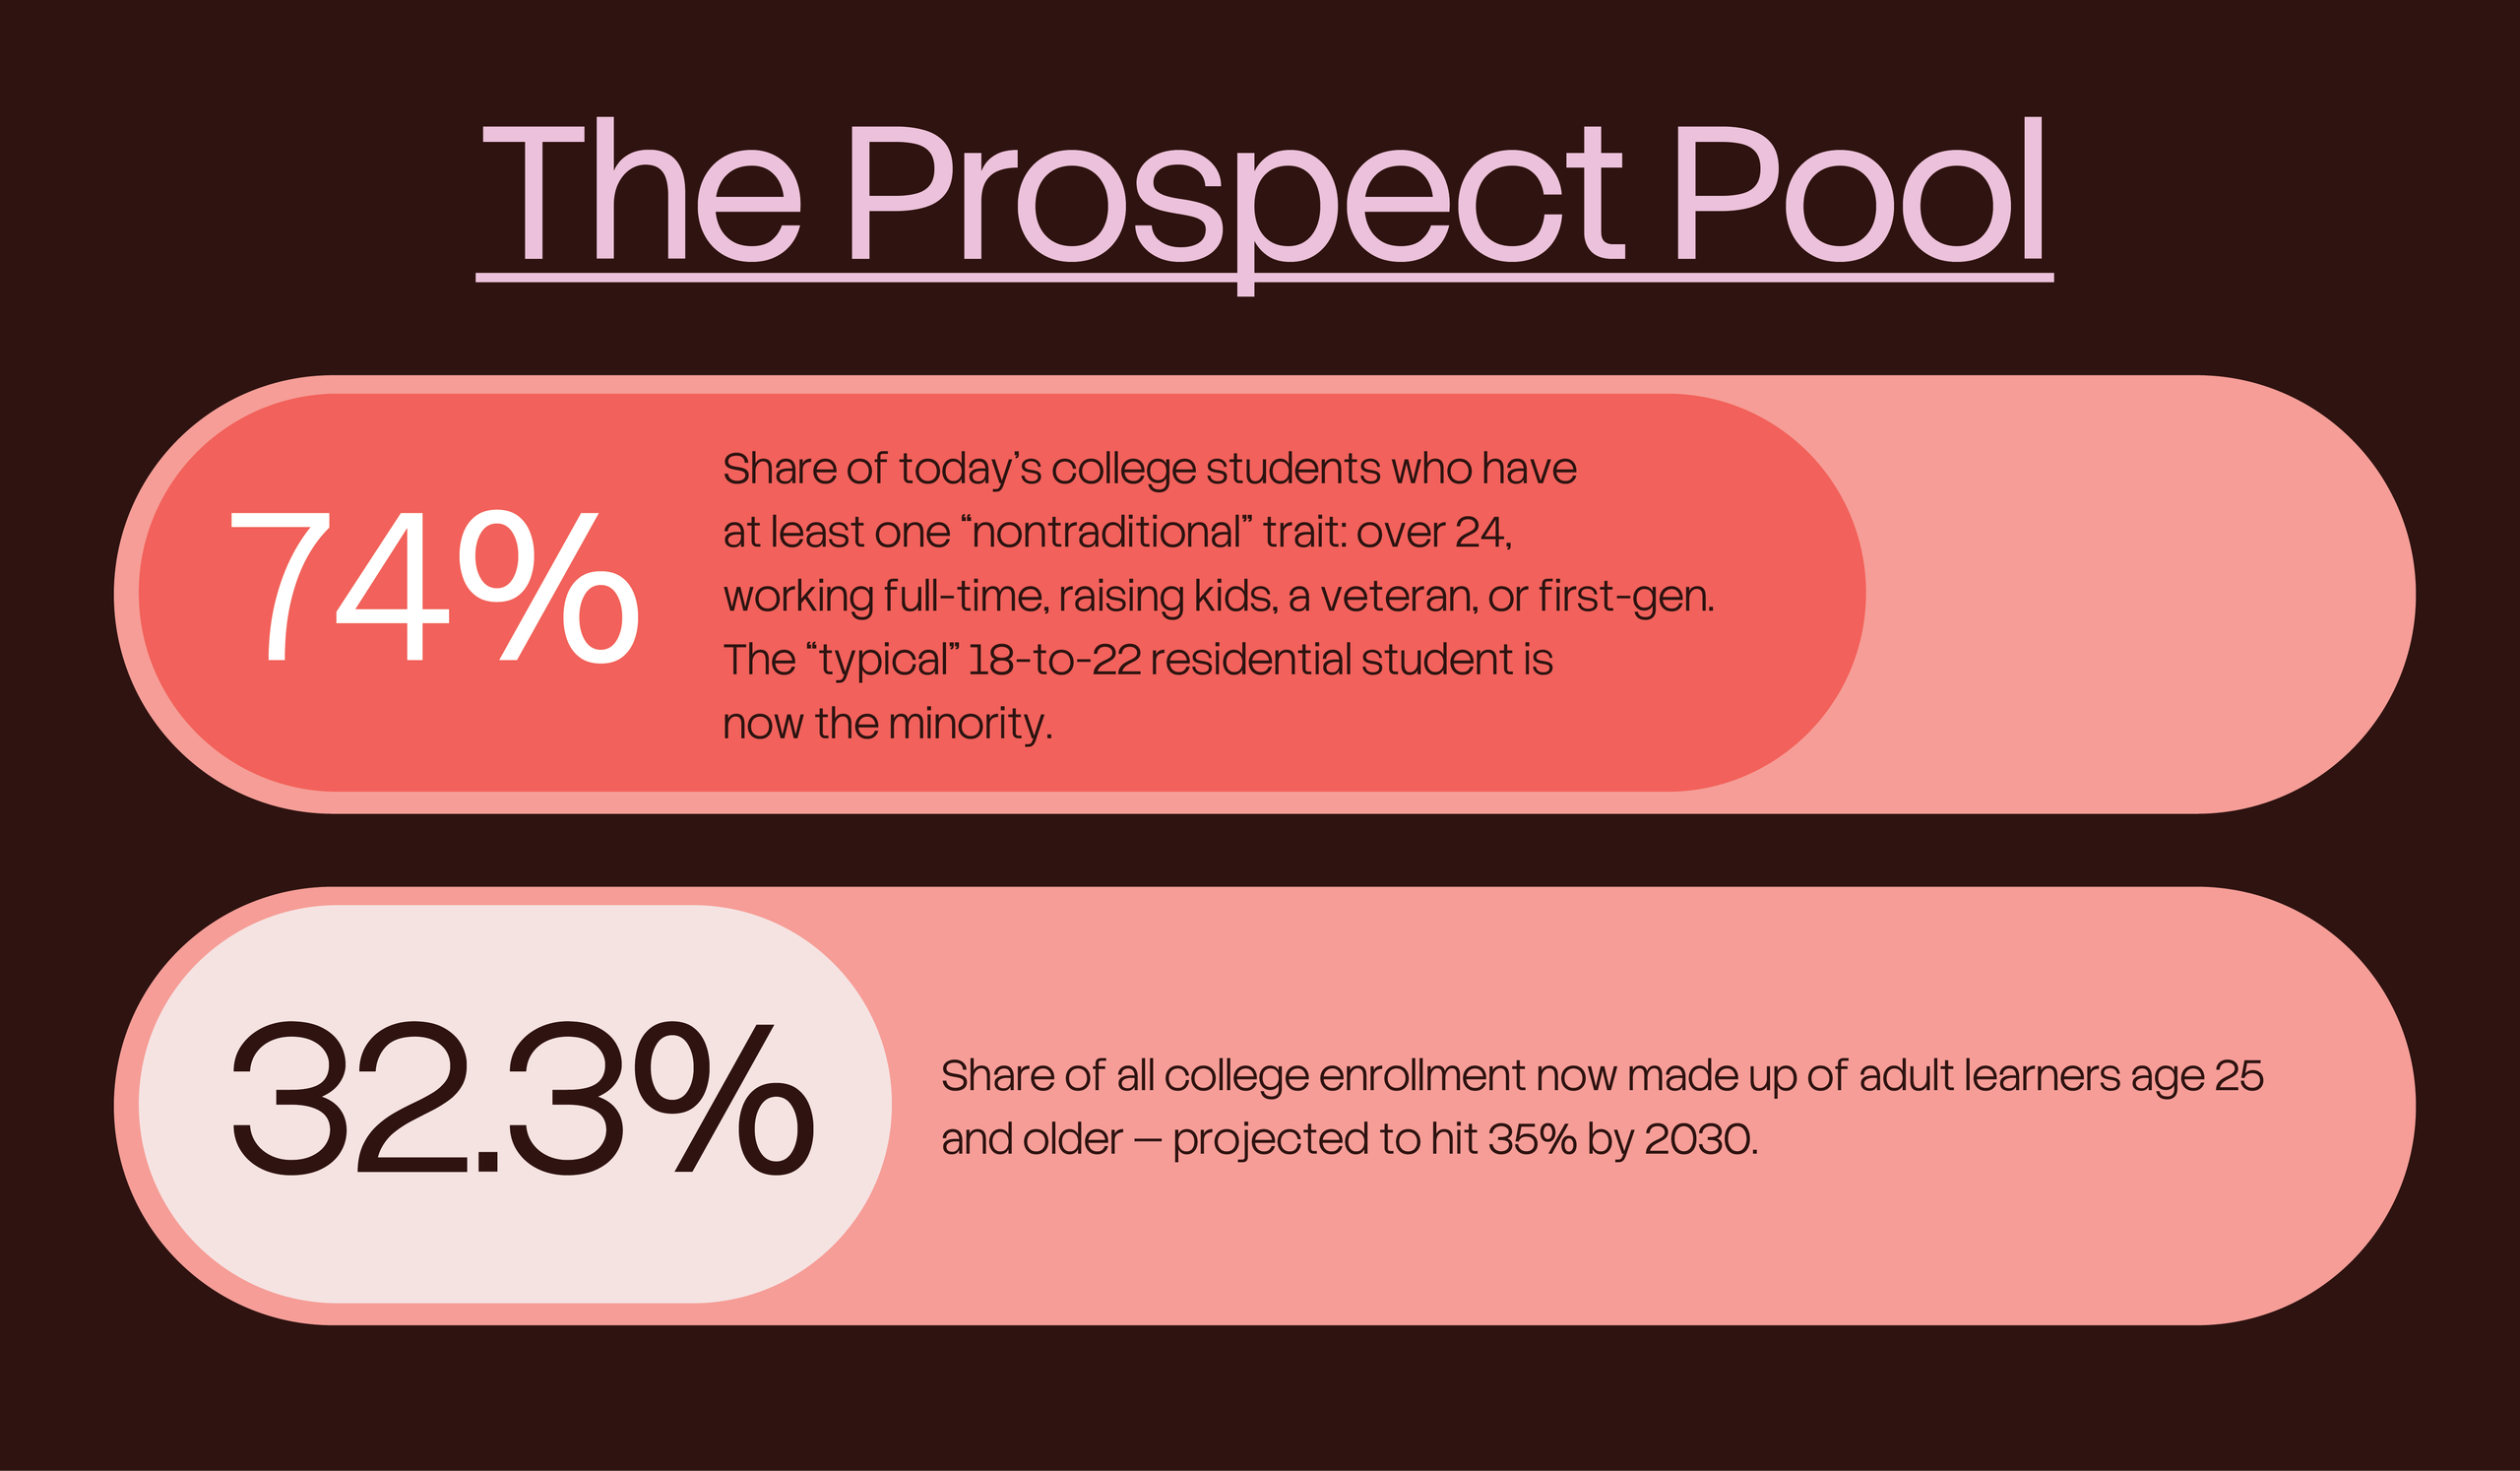
74% — Share of today’s college students who have at least one “nontraditional” trait: over 24, working full-time, raising kids, a veteran, or first-gen. The “typical” 18-to-22 residential student is now the minority. Forbes, citing Strada Education Foundation/NCES data, June 2025
32.3% — Share of all college enrollment now made up of adult learners age 25 and older — projected to hit 35% by 2030. BestColleges, “Adult Learners in College: Facts & Statistics”
Student Search Habits
6.8 — Average number of colleges a Common App applicant applies to — nowhere near the 20-or-30-school binges we hear about anecdotally. Common App / Pryor Education Insights, 2025 report
1.7% — Share of undergrads who name TikTok as their primary source for college discovery, versus roughly 41.5% for Instagram — even though students say they “live” on TikTok. The channel where they spend time isn’t the channel where they decide. Encoura / RNL, cited via TerminalFour and RNL blog research
50–100 — Number of marketing emails the average prospective student receives from colleges during their search — most of which get deleted unread. EAB, “Is email marketing to prospective students dead? Not so fast.”
Higher Ed Marketing Career Trends
$75,000 — Median salary for a higher ed marketing professional in 2026, up from $72,000 in 2025 — even as more than half still say their pay isn’t competitive with other industries. Concept3D, 2026 Higher Education Marketing Salary Report
11.9% — Average share of institutional revenue spent on marketing (although the median is a leaner 5.3%). UPCEA, 2024 Marketing Survey
69% — Share of higher ed marketing budgets that stayed flat or shrank heading into this academic year, even as the job keeps expanding. UPCEA / EducationDynamics data, cited in higher ed marketing benchmarks reporting
The Corner Office Turnover
$103,960 — Median annual pay for a postsecondary education administrator, as of May 2024. U.S. Bureau of Labor Statistics, Occupational Outlook Handbook
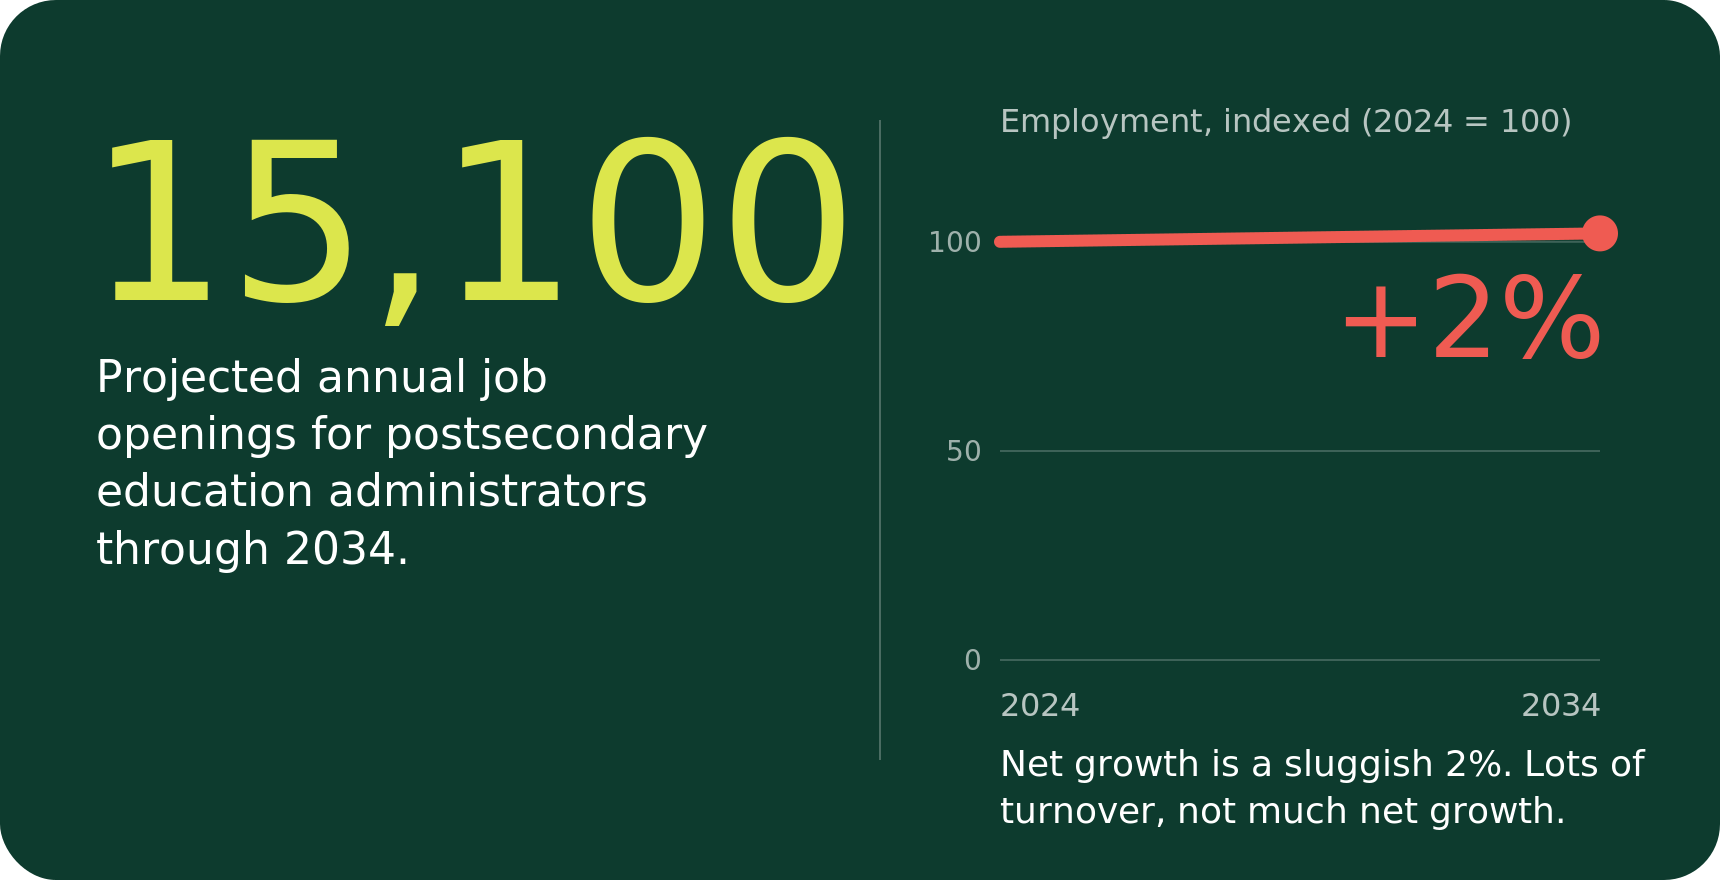
15,100 — Projected annual job openings for postsecondary education administrators through 2034 — even though overall employment growth in the field is a sluggish 2%. Lots of turnover, not much net growth. U.S. Bureau of Labor Statistics
5.9 years — Average tenure of a sitting college president in 2022 — down from 8.5 years in 2006. The corner office churns faster than it used to. American Council on Education, “American College President Study 2023”
Graduation Automation
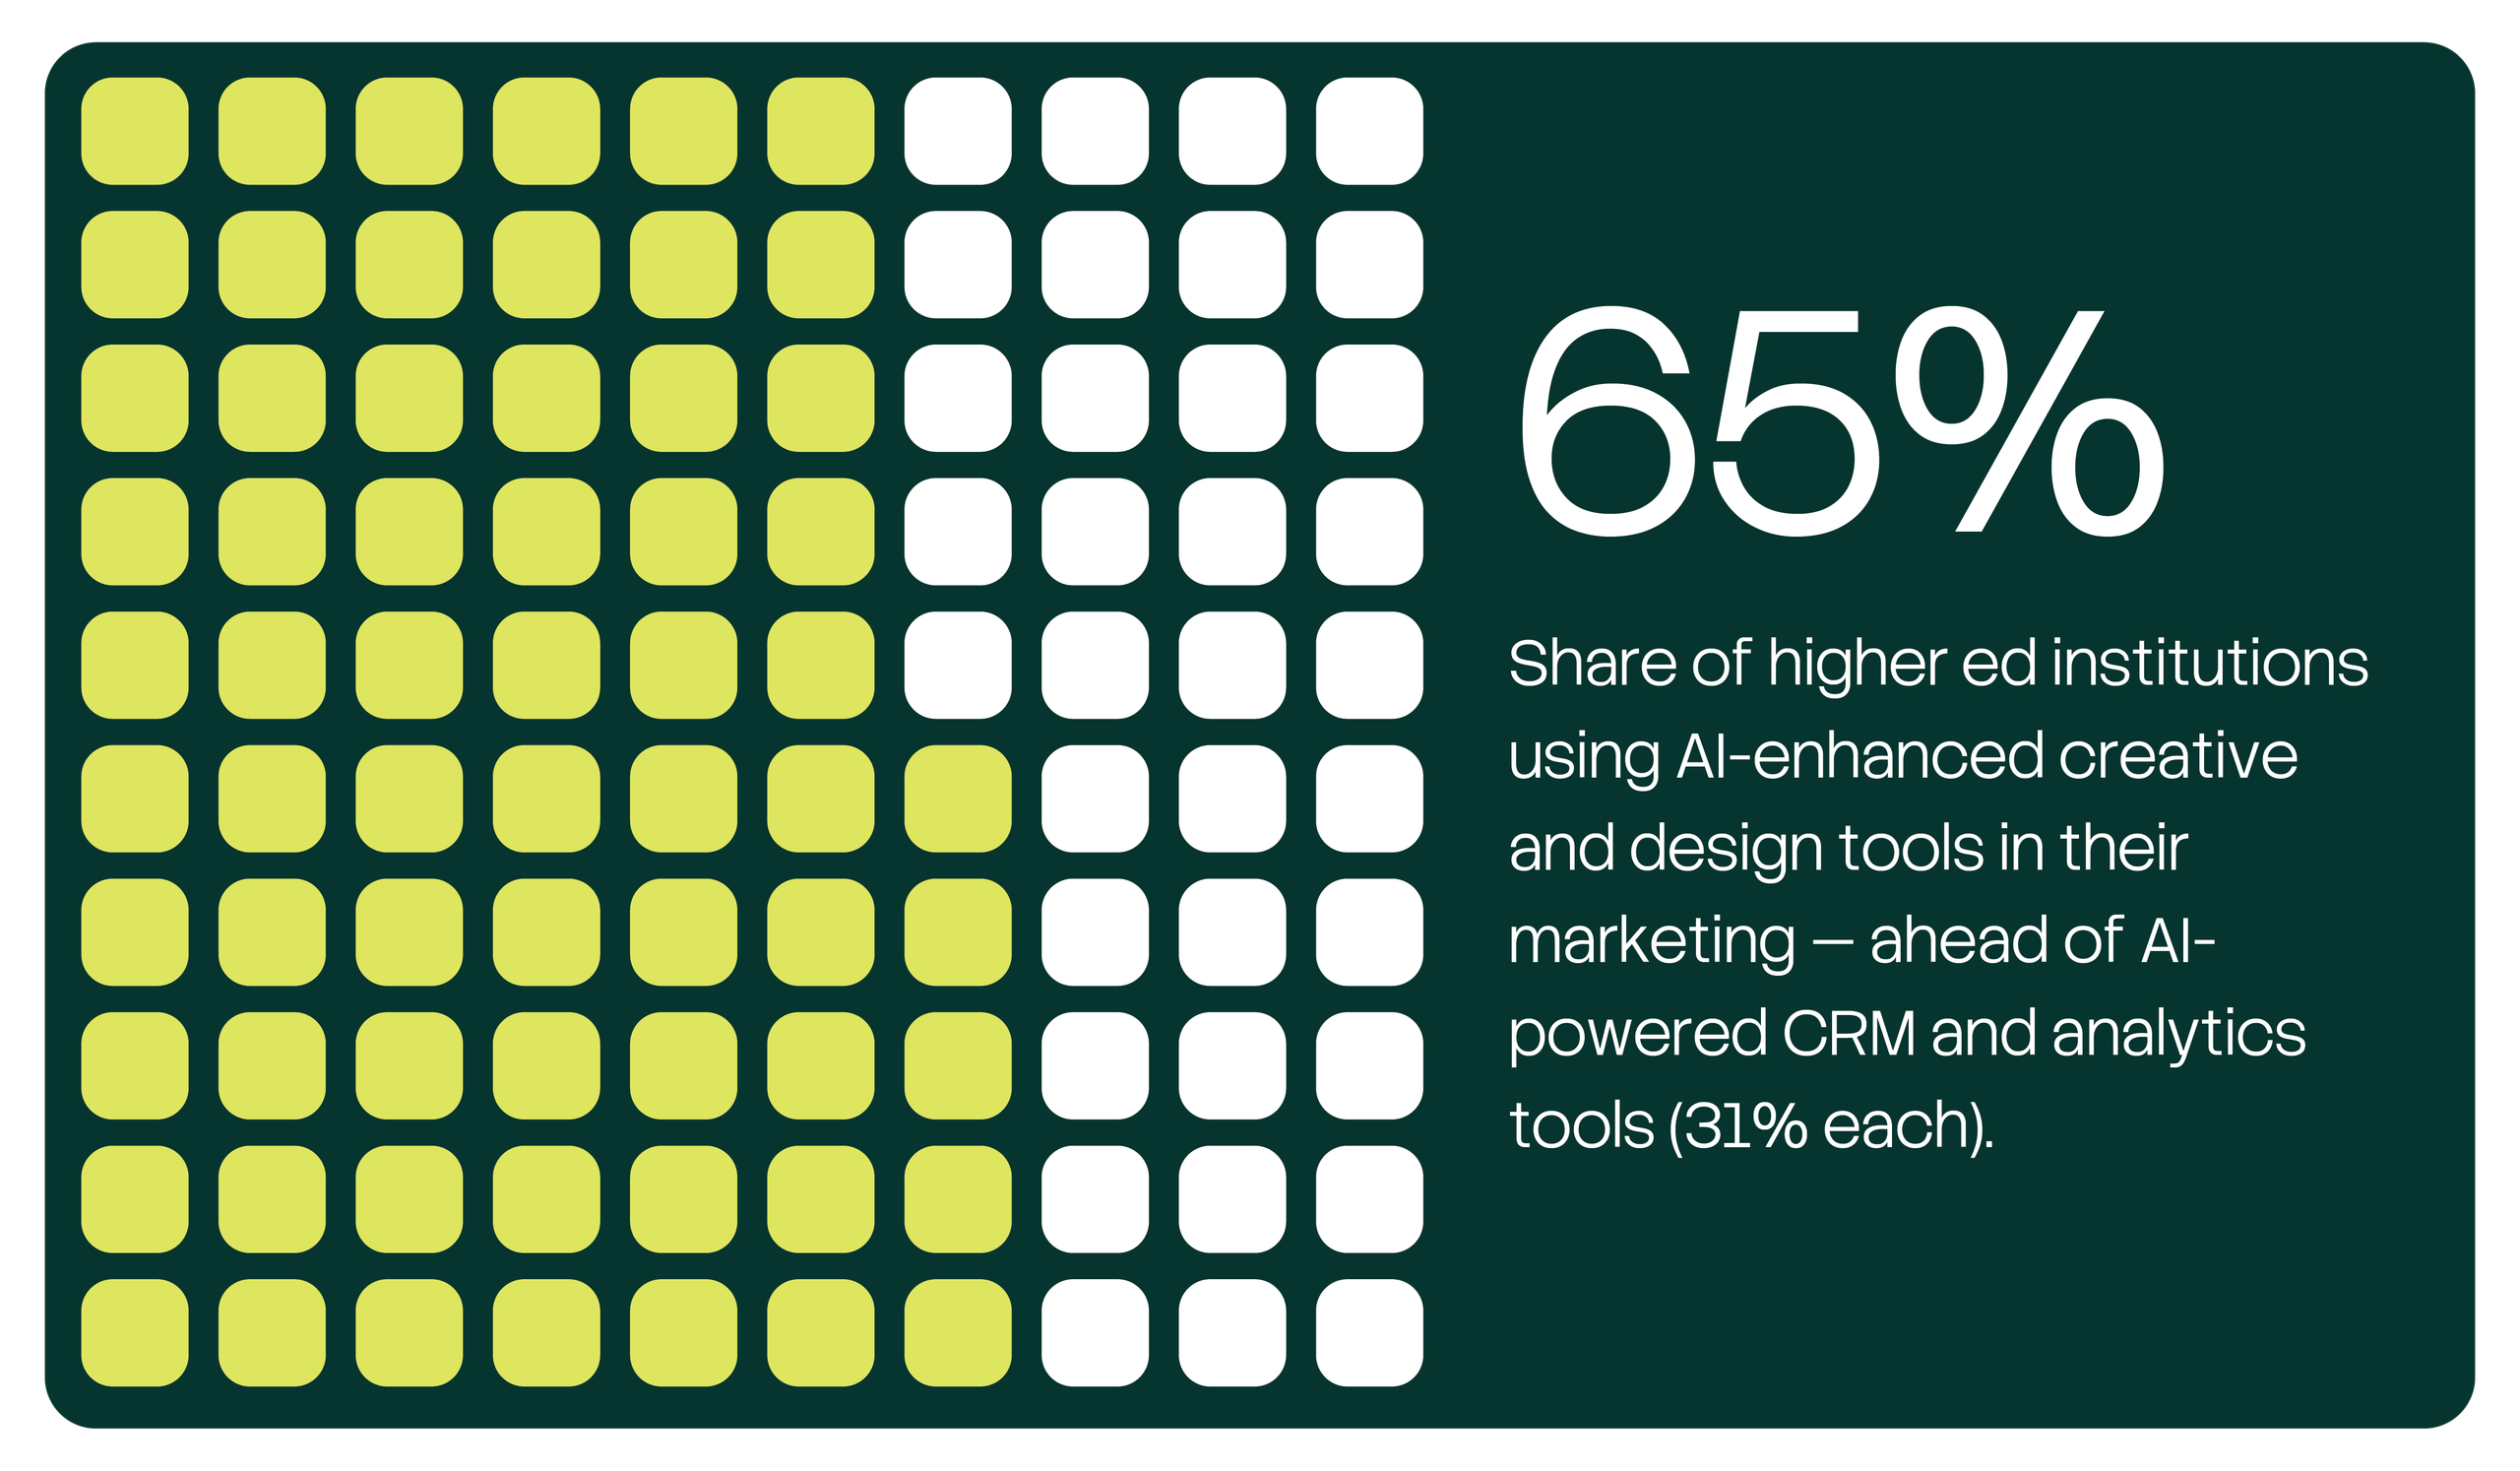
65% — Share of higher ed institutions using AI-enhanced creative and design tools in their marketing — ahead of AI-powered CRM and analytics tools (31% each). UPCEA/EducationDynamics, “Marketing and Enrollment Management AI Readiness Report 2025”
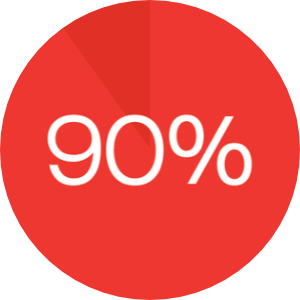
90% — Share of admissions chatbot users who rated the experience “helpful,” per a 2024 survey EducationDynamics, “Chatbots in Higher Ed”
The Price of a Prospect
$2,795 — Average amount a private four-year institution spends to recruit a single undergraduate — versus $494 at public institutions, a nearly 6x gap. Ruffalo Noel Levitz, “Cost of Recruiting an Undergraduate Student Report”
32% — How much the cost to recruit a student rose at four-year private institutions after the pandemic (just 5% at publics). Recruiting got a lot more expensive, unevenly. Ruffalo Noel Levitz, Cost of Recruiting report
16 — Number of nonprofit colleges that closed in 2025 — matching 2024’s total, with a Federal Reserve study projecting 80 more closures by 2029. The College Fix, tracking 2025 closures; CNBC on the Federal Reserve projection
Bulldogs, Bulldogs Everywhere

14 — Number of Division I schools whose mascot is a Bulldog, making it the single most common mascot name in college sports. theScore, “Infographic: Most common mascots among Division I schools”