A high-school junior researching nursing programs may never fill out an inquiry form. Instead, she finds a university’s program through Perplexity, watches current students’ dorm tours on YouTube, compares tuition on Niche, reads Reddit threads about campus social life, and asks a family friend in health care about job placement. By the time she visits campus, she already has a strong opinion about the school. The school’s CRM never saw her coming.
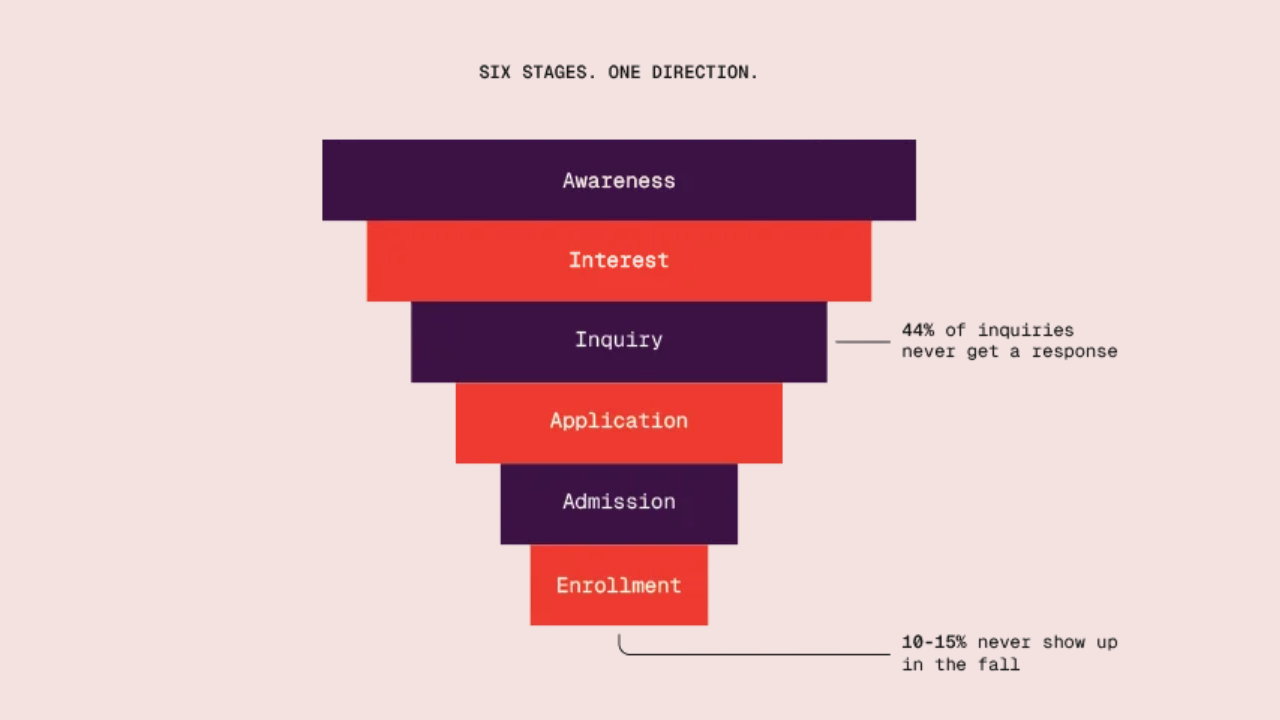
Sound familiar? It’s most of Gen Z’s college search. And it’s also why the enrollment funnel — the traditional path higher ed marketers use to track how prospective students progress through awareness, interest, inquiry, application, admission, and enrollment phases — is quietly failing the marketing and admissions teams who rely on it most.
For decades, enrollment marketers have mostly built their dashboards and budgets around these six stages, baked into day-to-day strategy and reporting templates at admissions offices nationwide.
For marketing and enrollment leads looking at just those numbers, everything might still appear fine. Inquiries clear annual targets. Application and admission tallies are on par with or higher than year before. Each item gets checked off as the pool of prospects filters down to the students expected on campus in August.
Then, the class misses its target goal.
“The traditional enrollment funnel, conceptualized as this consistent, linear journey doesn’t capture the totality of the student journey,” said Becca Smith, senior vice president of client strategy and services at higher ed marketing firm Electric Kite. “To market effectively, we need to introduce some flexibility and complexity.”
The surprise normally comes late in the enrollment cycle, despite enrollment teams believing they had enough volume. The massive number of inquiries includes students who never seriously considered the college, and applications jumped because it’s easier than ever to apply — not as a result of growing interest.
Deposited students eventually stop opening messages, then fail to complete their housing and financial aid forms. The enrollment dashboard recorded all of those students at a stage in the process. But it never showed they changed their minds.
The traditional enrollment funnel has been a university marketing blueprint for eons, tracking the administrative steps between a name and an enrolled student. But in 2026, it no longer explains the behaviors that produce university classes — and it doesn’t warn leaders in time to change outcomes.
For all practical purposes, the enrollment funnel is dead.
“[The funnel] is a helpful structure and a way to conceptualize how students make decisions about where they’re going to go to school,” Smith said. “But it’s not scientific, and reality doesn’t usually happen that way.”
Rather than a linear process, marketers are now responding to prospects using multiple channels and marketing assets simultaneously and sporadically throughout their journey. So instead of grouping users into unrealistic stages, they’re implementing a framework that treats every interaction as intelligence that can tell a more unified story and prompt more tangible action. For instance, the signal model looks at whether the right students know about a school, how they interact with it and the factors that influence whether they decide to enroll. It then connects those early signs to familiar numbers such as applications, the percentage of admitted students who enroll, and total enrollment.
The Funnel Used to Work, When Students Were More Visible to Schools
Higher education borrowed the funnel from corporate sales and marketing. College marketing and enrollment teams calculate the percentage of students moving from one stage to the next, then compare those rates with previous years.
After that, if a school realizes it still needs more students to complete a class, they might assign admissions counselors to weaker territories to help finish the job. The model worked better during previous decades, when colleges could more easily follow prospective students’ search. Institutions bought names, mailed pamphlets, paid for Google ads, collected replies and generally encouraged students to move forward.
A click, call, or inquiry required intent — a signal the student was at least moderately serious. Enrollment software tracked it all, keeping teams and trustees on the same page.
“We once relied on informational search as a key tactic in an effective paid media strategy,” Smith said.
The funnel served two purposes at once: it structured how teams processed students, and offered a theory of how they chose. The first still works, mostly. The second has broken down.
A 2026 Electric Kite survey of university marketers found just 12.5 percent were “very confident” their school’s enrollment metrics predicted enrollment outcomes. Only 5 percent believed the funnel reflected how students actually behave, while 52.5 percent called student behavior “much more unpredictable” than the funnel suggests, or said it “doesn’t reflect student behavior at all.”
From Funnels to Pinballs
Jeff Holeman, chief marketing officer at the University of Florida’s Warrington College of Business, has spent the past two decades in university marketing, including three years at Florida. He’s leading the college’s marketing transformation away from the traditional enrollment funnel after concluding, similar to Smith, that the linear model is outdated.
Early in Holeman’s career, the funnel offered real benefits as a “reporting model,” he said. But it’s becoming increasingly irrelevant.
“What we’re doing is adapting as our world has changed around us,” Holeman said. “That starts with the understanding that the enrollment funnel is not the decision model.
The funnel is an excellent reporting framework, but it’s never been an accurate model of how people decide where to go to college.”
Marketing strategist Rand Fishkin, founder of the audience research firm SparkToro, dubs it the pinball customer journey. Fishkin argues that consumers, including prospective university students discerning where to enroll, no longer move through a small handful of predictable channels before making a purchase. Instead, they bounce around.
“There are so many mediums now for brands to gain exposure and consumers to gain information,” Fishkin said, “and it’s not in any way linear or fully trackable.”
Prospective students can also move backward, which the funnel doesn’t consider. A financial aid offer can send an admitted student comparison-shopping. A disappointing campus visit can cool interest that has been rising.
But the backward movement isn’t a final direction, either. Case in point: an enrollee having second-thoughts about a school might find renewed interest after a productive phone call with a faculty member. Per Fishkin, students don’t completely lock into each stage of the enrollment funnel. Their interests simply change as they receive new information.
“We can’t bury our heads in the sand and pretend like the funnel is the best way to describe real customer journeys anymore,” he said.
Higher education has seen its own version of this shift: instead of typing “best nursing programs” into Google, more students are asking ChatGPT to compare three specific nursing programs by cost and prestige.
A recent study by EducationDynamics found that 51 percent of students now use AI chatbots somewhere in their college research, and that more prospective students are researching financial aid — a late-funnel step in the old model — before ever applying. Per Holeman, that means universities relying on the traditional funnel in 2026 are handicapping themselves with major blind spots.
Schools can still follow parts of a student’s journey on their own platforms and in their own CRMs. But they miss almost everything happening off-platform, where more students than ever are actually making their decisions.
“Students now learn about an institution from a magnitude of outside sources,” he said. “And a student may have spent weeks or months deciding what’s even worth considering long before they submit any kind of inquiry, an important part of the process that the funnel doesn’t account for.”
Deciphering What’s Real on the Dashboard
The gap between what the funnel dashboard shows and what actually drives enrollment has perhaps never been wider. And it starts at some of the earliest stages.
The University Professional and Continuing Education Association’s 2025 biennial Secret Shopper Analysis, which tests how schools respond to prospective student inquiries, found a whopping 44 percent of inquiries went completely unanswered in 2025, worse than in 2023 and 2021. Institutions that did respond took an average of 14 hours and 23 minutes; even the median was more than three hours.
Ruffalo Noel Levitz found that nearly half of prospective students expect a response within 24 hours, and that their interest drops the longer they wait. The funnel records the inquiry but treats all them as equal — without accounting for the obvious fact that a three-hour response produces better odds of an application than a 14-hour one.
Allison Turcio, dean of enrollment and marketing at Siena University, said it’s “common sense” that the odds change — most departments are well aware. Yet the funnel treats all inquiries as the same.
“If I have hundreds of inquiries, I shouldn’t just count them all as inquiries,” Turcio said. “Their sources, where they came from and when they first interacted with us matter.”
The gap widens further along the journey: 10 to 15 percent of students who complete every stage in the funnel never show up in the fall. Summer melt happens almost entirely after a funnel dashboard would already mark them enrolled.
Turcio, who has spent 20 years in Siena’s marketing and communications department after graduating from the school in 2006, now hosts her own biweekly podcast on enrollment marketing. She contends a funnel stage doesn’t capture why a student melted. Perhaps a financial aid package that looked fine in March became too little in August. Or a competing offer from another school may have surfaced in June.
As the cost of higher education keeps climbing, price and financial aid availability remain leading factors in students’ final decisions. For the low-income and first-generation students who make up a sizable share of summer melt, the cause is often a family situation or a need to start working. Not necessarily a problem with the institution itself.
“Too many schools are stuck in a one-sided view of what’s happening,” Turcio said. “They don’t see what’s going on behind the scenes.”
The funnel dashboard misses warning signs that a signal-based model could catch earlier. Holeman and Turcio both point to a student’s behavior after visiting campus as an important tell.
A signal model, for example, might follow which webpages a deposited student returns to. If they stop visiting pages about financial aid or the specific program they want to study, that’s often a better predictor of a no-show than anything sitting in an application file.
Meanwhile, a stage-based system can’t measure that. It only has “deposited,” a status that looks identical whether a student is planning to move in or already leaning toward another school.
“Those gaps expose a major problem with the stage-first dashboard,” Holeman said. “It can show a school admitted a student, but on its own it can’t show whether the student understood the cost of attending or how well they enjoyed their visit, or even whether they’re entertaining offers from competing schools.”
“I think if you’re only looking at the traditional funnel and using the same conversion points and your throughput, you’re not going to come out with an accurate prediction,”
Turcio added. “You’re going to be shocked. We might track someone when they apply. We might track someone who inquired. But there are so many other things happening that are hard to surface and hard to see.”
Signals, Not Stages
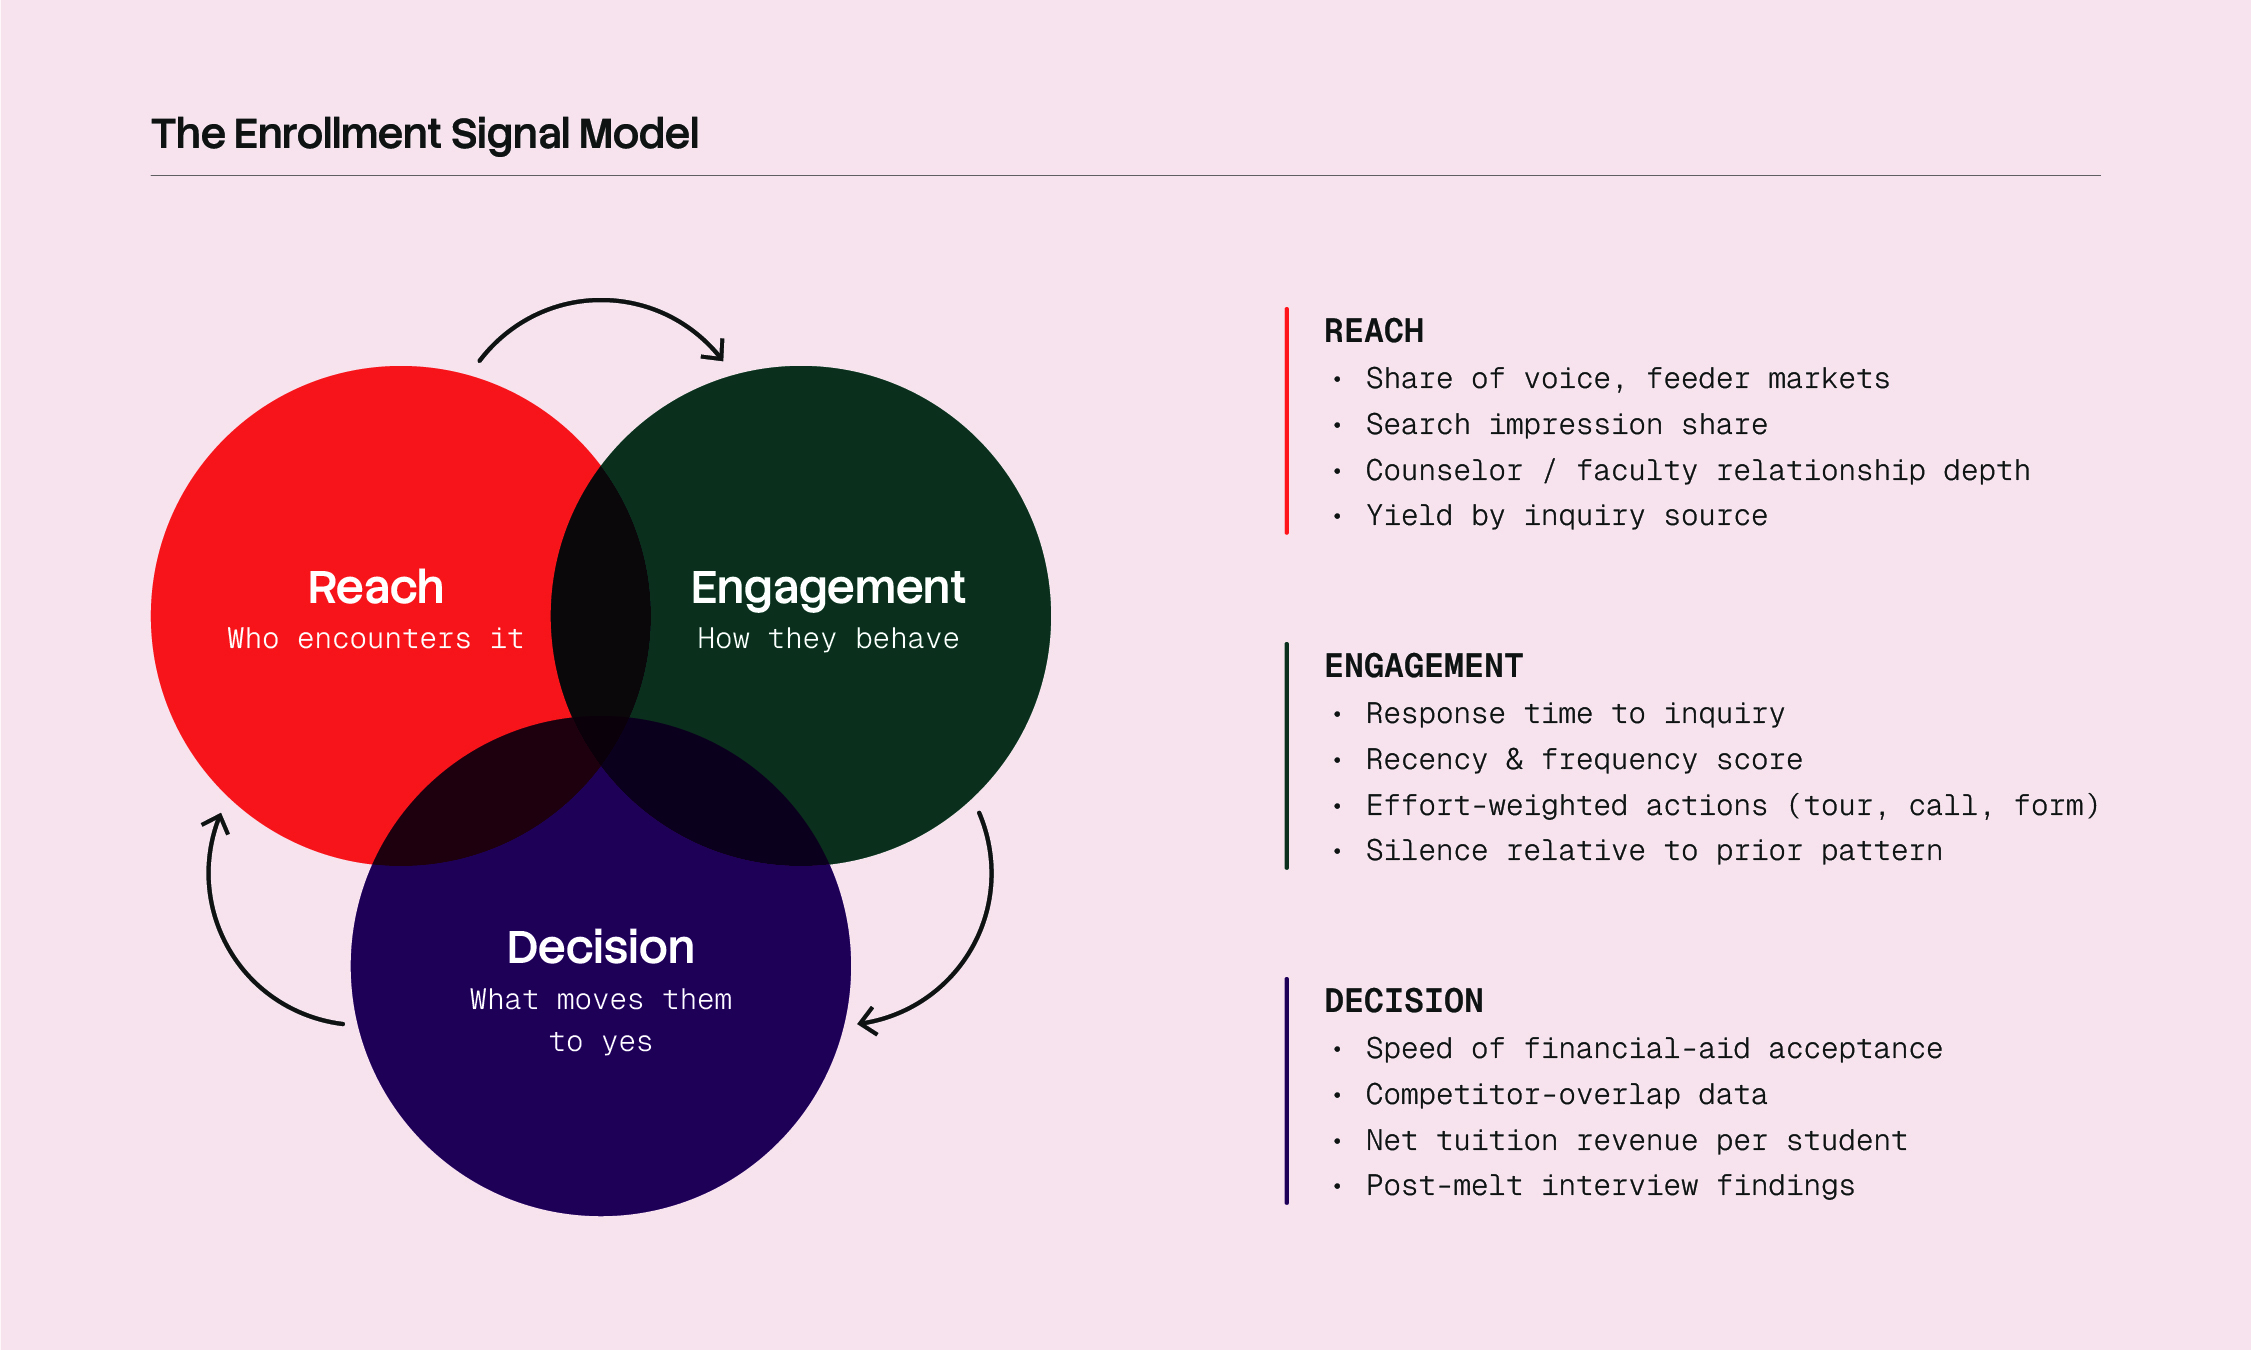
Marketers and survey respondents agree: enrollment marketing needs a model of what students are actually doing, not which stage a database puts them at. The signal model isn’t a wholesale replacement for every institutional metric. Instead, it reorganizes metrics around three signal categories: Reach, Engagement, and Decision, which together represent how a recruiting cycle actually plays out.
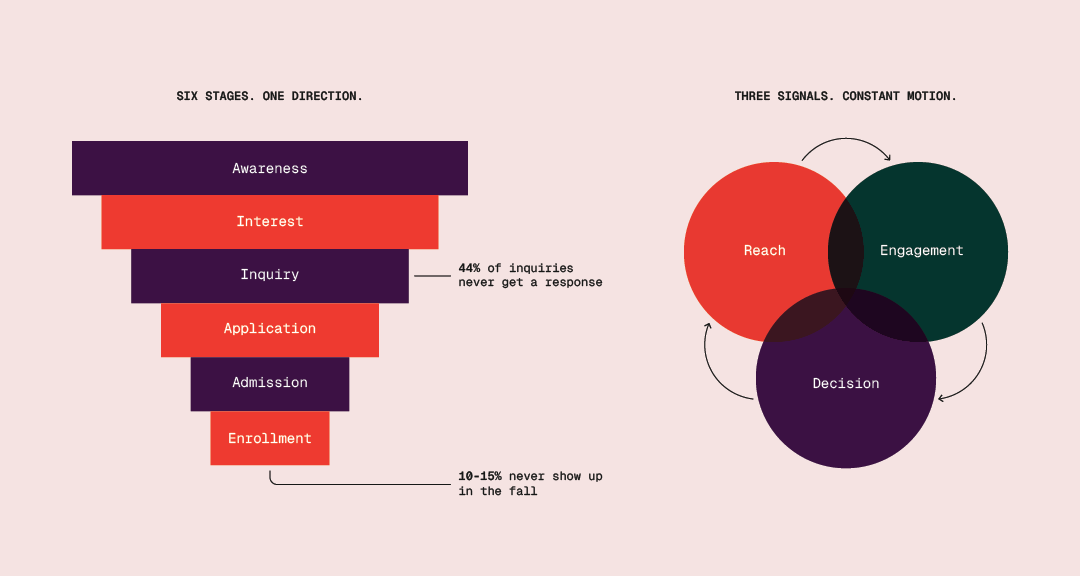
Reach signals show whether schools are getting the right students to encounter their institution, and the impression that contact creates. Engagement signals detail the quality, timing, and pattern of their interactions. Decision signals follow the inputs most likely to drive students’ final decisions.
The categories can overlap or bleed into each other. A campus visit starts as engagement and can become a decision signal once the college connects completed visits with yield. Ditto for a financial aid offer when a student moves from opening it to accepting it.
“The enrollment signal model gives marketing and admissions teams some indicator of where a student is in the journey based on the student’s behaviors and engagement, rather than relying on the calendar of the recruitment cycle,” said Smith, the Electric Kite executive.
This approach also requires segmentation, Smith noted: a 30 percent yield rate may look healthy, but could mask a collapse among first-generation admits in a specialized program like engineering behind strong performance among local legacy students in liberal arts.
Smith, Turcio, and Holeman suggest segmenting by program, geography, student type, income proxy, or inquiry source — whatever’s large enough to matter.
Reach: Legitimate Consideration Instead of Simple Awareness
Reach signals measure something the old funnel’s raw inquiry count never captured: how many of the right prospective students encountered the institution in a context built for genuine consideration, and how they felt about it.
“The reach layer asks a better question,” Smith explained, “Did the institution become visible to students it can serve, in places that foster serious consideration?”
Share of voice in key feeder markets offers one plausible answer. A university defines its most important feeder markets, compares its presence against competitors across paid search, organic search, local media, school events, counselor contact, and social channels. The goal isn’t a score — it’s showing up where the most-likely prospective students gather information and build their lists.
Search impression share for high-intent queries matters more as students lean on AI-generated summaries — a school either gets named or it doesn’t, Holeman said, so marketers should do everything possible to show up for the criteria they want to be known for.
The depth of relationships students and their families feel toward counselors, professors, staff, coaches, and other influencers matters just as much — a counselor’s recommendation often carries more weight with a family than any paid media an institution can run. The Ruffalo Noel Levitz report found that first-generation families were especially influenced by contact with counselors, fairs, admissions staff, and faculty.
“And there are many ways to track that,” Holeman said. “Above all, just making sure you’re putting the right people out there for students to easily discover and access is incredibly helpful.”
Yield by inquiry source shows which channels actually convert, not just which generate volume. Holeman recommended tracking every source application, admit, deposit, enrollment, and net tuition results — a more accurate story than the funnel’s top-line numbers. A channel producing 1,000 inquiries at a 2 percent yield costs more than one producing 200 inquiries at 20 percent, even though funnel dashboards call the former the bigger win. Quality-weighted reach begins with the students who actually enroll.
Engagement: Understanding Current Levels of Interest
Engagement signals happen after contact, tracking not whether a student advanced to another stage, but what interactions they’ve made lately with the school, how often, and with how much effort.
“Engagement signals capture how prospective students are actually behaving once they know an institution exists, which reach signals alone can’t illustrate,” Smith explained. “Data on actual behavior matters more here than where they are in the funnel, because two students in the same funnel stage can be in very different places.”
Actions carry different weights — a reply outweighs an opened email; showing up for a campus tour outweighs registering for one; filling out a financial aid application outweighs clicking to read about it. Smith believes institutions should rank interactions by quality and depth, then test their rankings with final enrollment tallies during several cycles.
A simple rolling score is a good place to start, Turcio said: score how recently a student completed a meaningful action, track interaction frequency over a week to 60 days, and add points effort — a campus tour, a call with faculty, or responding to a financial aid offer. Teams can subtract points for negative actions, like a missed appointment, an unfinished form, or repeated requests for information already given.
“Scores tracking engagement recency and frequency can help us answer many of our questions about what students are thinking,” she said. “A student who engaged twice over the summer is different from one who engaged twice in March, even if they’d both technically be in the same funnel stage.”
Response time to inquiry might be the single most predictive and most neglected metric in the industry, Turcio said — and a student’s silence is usually the most telling change signal. A student who engaged every week and then goes quiet for a couple of months deserves attention before they melt, though teams should measure that silence against the student’s own earlier pattern, not a universal cutoff.
Turcio also flagged a risk: teams should prioritize consented, first-party behavior and regularly audit scores for bias. Students with jobs, limited home internet, or long commutes may engage differently than students who don’t — without being any less interested.
Decision: Measuring the Forces Closest to Commitment
Decision signals are the hardest category to measure directly, Holeman said — which is exactly why most institutions fall short or don’t even try. The inputs that most directly drive final decisions often happen outside institutional visibility: students compare colleges in private, where universities can’t see or influence them.
But proxy measures exist, and they’re more available than most enrollment offices think.
When and how fast a student accepts a financial aid package is among the most important factors, Holeman said — a student who accepts within a week is behaving very differently from one who sits on it for a month, even if both eventually say yes.
Competitor overlap data — the other schools admits are weighing, and at what yield rates — gives that price context. Schools can gather it while negotiating financial aid, through admitted-student surveys, and by matching students to their eventual destinations.
Then net tuition revenue per enrolled student, when segmented rather than just combined into a final number, tells schools whether they’re earning the enrollment numbers they want at a cost they can sustain.
“A headcount figure alone will never reveal that,” Holeman said.
“A headcount without price can lead institutions into buying a class it can’t sustain.”
One underused decision signal is the post-melt interview: reaching out to students — by phone where a team has bandwidth, by short survey where it doesn’t — to ask why they chose another school. The answers students give provide marketers with their most valuable data.
Give Leaders a Dashboard They Can Act On
None of the three signal categories work well on their own — this approach works only when all three come together, and when they conflict with one another.
A spike in reach with no jump in engagement usually means the wrong audience is getting a campaign’s attention — something the funnel would never catch.
But the signal model will have little impact if enrollment teams use it privately while leaders keep receiving only a funnel. The reporting structure has to change too. A two-layer report, tracking both health and performance, is required.
The health layer brings three to five leading indicators that tell leaders in real time whether the recruitment cycle is on track: response time, engagement score trend, financial aid acceptance rate, and yield rate broken out by segment. These indicators move before a final outcome and should reach leaders regularly.
“It’s a way for (leaders) to better understand where a student is on that timing,” Electric Kite’s Smith explained.
The second is a performance layer, the lagging metrics leaders already track: application volume, yield rate, and enrolled headcount, reported with context instead of as the full story. It’s reframed as an outcome of signals, not a primary indicator.
Building both layers doesn’t require new infrastructure, Smith said. Response time and financial aid engagement already live in a CRM. Marketers just need to move that data onto the same data sheet leadership already receives every month. Yield by segment is a filter on data institutions already have, not a new dataset. The post-melt interview is perhaps the only genuinely new process, and it requires only a phone call or email.
To satisfy the politics of change, marketers can frame this as an added resource, not a substitute — it doesn’t ask a president or board to stop caring about yield rate. The pitch is simple: The funnel told you the story after your class arrived. The signal model tells you while you can still do something about it.
Quoted in this article:
Becca Smith is senior vice president of client strategy & services at Electric Kite, a full service creative agency.

Jeff Holeman is chief marketing officer at the University of Florida’s Warrington College of Business. He has previously led marketing at the University of California, Berkeley, Arizona State University, Keene State College, and the University of Rochester

Allison Turcio is the dean of enrollment and marketing at Siena University. She also hosts The Application Podcast about the future of enrollment, marketing, AI, and the student experience.

Rand Fishkin is CEO and cofounder of Sparktoro and the co-author of the book “Zero Click Marketing.” Prior, he was CEO and cofounder of Moz and Inbound.org.