
If you’ve ever stood in front of a cabinet or board and tried to explain click-through rates, you probably know the feeling: you’re saying words, showing charts, and watching eyes glaze over.
That moment is where this work began for us at Gettysburg College.
A few years ago, our board of trustees approved a significant new investment in marketing. It was a major step forward—and a clear vote of confidence. But it also came with an expectation: show us what this is doing.
Not “tell us what you’re doing.”
Not “walk us through your tactics.”
But show us the impact.
That distinction is where the challenge—and ultimately the opportunity—emerged.
The Problem: Too Much Data, Not Enough Meaning
Like many institutions, Gettysburg College is navigating a familiar set of pressures: demographic shifts, increased competition, changing student behavior, and heightened price sensitivity. We believed strongly that increased marketing investment was part of the solution—but belief alone wouldn’t sustain that investment.
We needed to demonstrate effectiveness in a way that leadership could understand and trust.
Initially, we did what most marketing teams do. We reported on tactics and performance metrics:
- Impressions were up
- Engagement rates were strong
- New channels were performing well
- We were running campaigns we had never been able to run before
From a marketing perspective, this was exciting progress.
From a board perspective, it was confusing.
As we presented what we thought was a compelling story—PPC, retargeting, SEO, streaming audio—the reaction in the room made something clear: we weren’t answering the question they were actually asking.
They weren’t asking, “What are you doing?” They were asking, “Is it working?”
And we didn’t yet have a clear way to answer that.
The Initial Challenge: Bridging Two Worlds
There are two fundamental challenges in marketing accountability within higher education.
First, expectation management. There is no straight line between marketing spend and a deposited student. Marketing doesn’t “produce” enrollment in a direct, one-to-one way—it shapes awareness, perception, and preference over time. Helping leadership understand that reality is essential.
Second, translation. Even when expectations are aligned, the way we talk about marketing often doesn’t translate outside of our field. Metrics that are meaningful to marketers don’t always mean anything to trustees or senior leaders.
We needed a way to bridge those two worlds:
- Grounded in real marketing logic and data integrity
- But simple enough to communicate clearly in a boardroom
That’s where the Digital Marketing Performance Index (DMPI) began.
Building Something That Works in the Boardroom and the Back End
Now that we had access to a significantly improved budget, we were investing in blends of different strategies we previously hadn’t been able to test in the market. And once we had access to dashboards with measurements from all the different tactics, organizing those results clearly through the lens of optimizing our spend was difficult. We tried different approaches, and comparing results during different time periods felt like comparing apples and oranges. We needed a better method, not only for reporting our progress, but for planning our direction.
Using what we understand about the value of different KPIs, we developed a system for weighting performance metrics. We aggregate measurements across channels into categories, calculate weights that appropriately anchor conversion metrics relative to lighter-weight indicators, then pull everything into one single index (the DMPI). After we complete this exercise, we do the same for a previous time period using the same weights, which allows us to compare overall performance between the two periods being evaluated. An important point to note is that the index itself doesn’t have intrinsic value. It only has meaning when it can be compared to the index of a separate (but similar) time period. We usually compare year-over-year data.
Further analysis compares the change in the DMPI to the change in spend for the same two time periods: growth isn’t our only goal. We need to prioritize efficiency, too; and tying the change in index as an outcome of a change in expenditure makes the connection to our marketing investment in a way that College leadership can understand. When we tell them that the DMPI increased by 17% while the spend dropped by 2%, it’s easier for them to conceptualize the results of our marketing strategy than it is when they are given too many different results to consider.
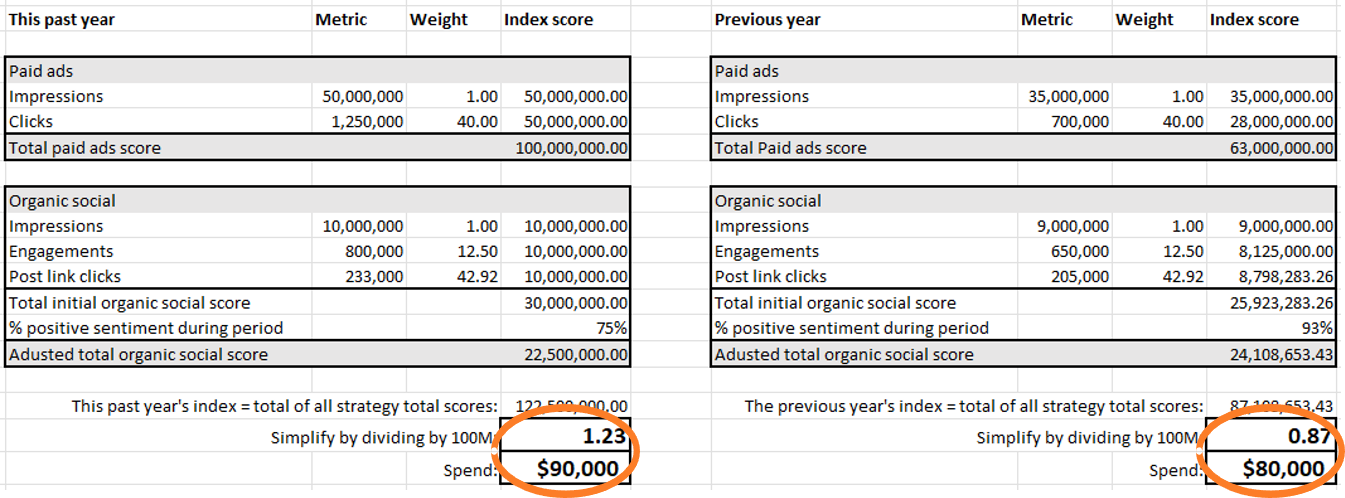
Building Your Own DMPI
The illustration above is a good starting point for creating your own comparative index. Add all the categories that would be helpful in meeting your reporting goals. Simply group the metrics in a way that allows you to define the relationships between the most lightweight measurement and all the other measurements for those tactics, then be sure to apply the same weights to the previous time period so the data are normalized equitably.
Even if you pulled data last year to do this exercise, it’s important to pull it again when you pull the most recent data. This improves confidence that the data points for both time periods are impacted consistently by dashboard and analytics platform functionality (which may vary over time).
If you have halted a tactic from one year to the next, add the measurements in the year it was executed, and add zeroes in the year it was not. If you started a new tactic during the most recent time period, add the measurements under the column for the most recent time period, and add zeroes in the columns for the previous range.
You can add as many different categories into your index as strategies you can measure.
Complexity Made Actionable
With the DMPI, each layer of complexity in our metrics helps us build more confidence in our outcomes. Multiple touchpoints and different types of value are incorporated into a single index, and signals are considered with different levels of influence.
An additional benefit of this work is that we can now run mini-DMPI models to answer strategy questions related to specific tactics or to blends in only certain parts of the marketing funnel. These focused calculations tell us which time periods yielded the most effective impacts. Not only does the DMPI help us translate results into something decodable by trustees and senior leaders, it helps inform our strategies for future plans. Ultimately, we’ve observed the DMPI becoming a self-fulfilling tool where:
DMPI helps inform strategy –> improved strategy yields better results –> DMPI helps us translate our gains into easily digestible results.
From Tactics to Strategy to Trust
The biggest shifts the DMPI enabled wasn’t just better reporting—it was better strategy and better conversation.
Before, our updates to leadership often felt like a defense of activity:
- Here’s what we ran
- Here’s what performed well
- Here’s what we’re trying next
After implementing the DMPI, the conversation changed.
Now, in a board meeting our report is something like:
“Our index improved by X points, and our spend decreased by Y percent.”
That one line answers the core question: Is it working?
From there, we go deeper:
- What’s driving the improvement
- Where performance is lagging
- How we’re adjusting in real time
What We’ve Learned
After several years of using the DMPI, a few principles stand out:
- Define what “working” means early. If leadership expects a direct line from ad spend to enrollment, you’ll always be on the defensive. Align on what marketing can—and cannot—do.
- Normalize complexity, don’t ignore it. You don’t need to show every metric. You need a way to bring them together into a coherent story.
- Complexity can be an asset. The more sophisticated your measurements are, the better confidence you can have that they’re painting an accurate picture.
- Use one consistent language. The power of the DMPI is that it creates a shared system of understanding.
- Pair data with narrative. We always complement the index with examples of actual content—stories, campaigns, creative work—so leadership sees both performance and substance.
- Collaboration is essential. This only works when marketing and admissions are aligned. Looking at marketing performance alongside funnel data creates a much more complete picture.
In a moment when higher education leaders are being asked to make increasingly complex, high-stakes decisions, this shift—from data to understanding—made the difference for us.